
Six variables, 3.7 million households and a portrait of the territory that the real estate boom ignores
SANTO DOMINGO. – The X National Population and Housing Census 2022, in its Fascicle II published by the National Statistics Office in May 2026, took note of how 3,726,936 Dominican households drink water, use it for cooking and bathing, dispose of their sanitary waste and get rid of their garbage.
The result is the most detailed map that exists on the real living conditions in the country, broken down to the municipal district level in 157 municipalities and 235 districts.
For the real estate sector, that map is a territorial reading tool that almost nobody uses.
The street drinking as a national standard
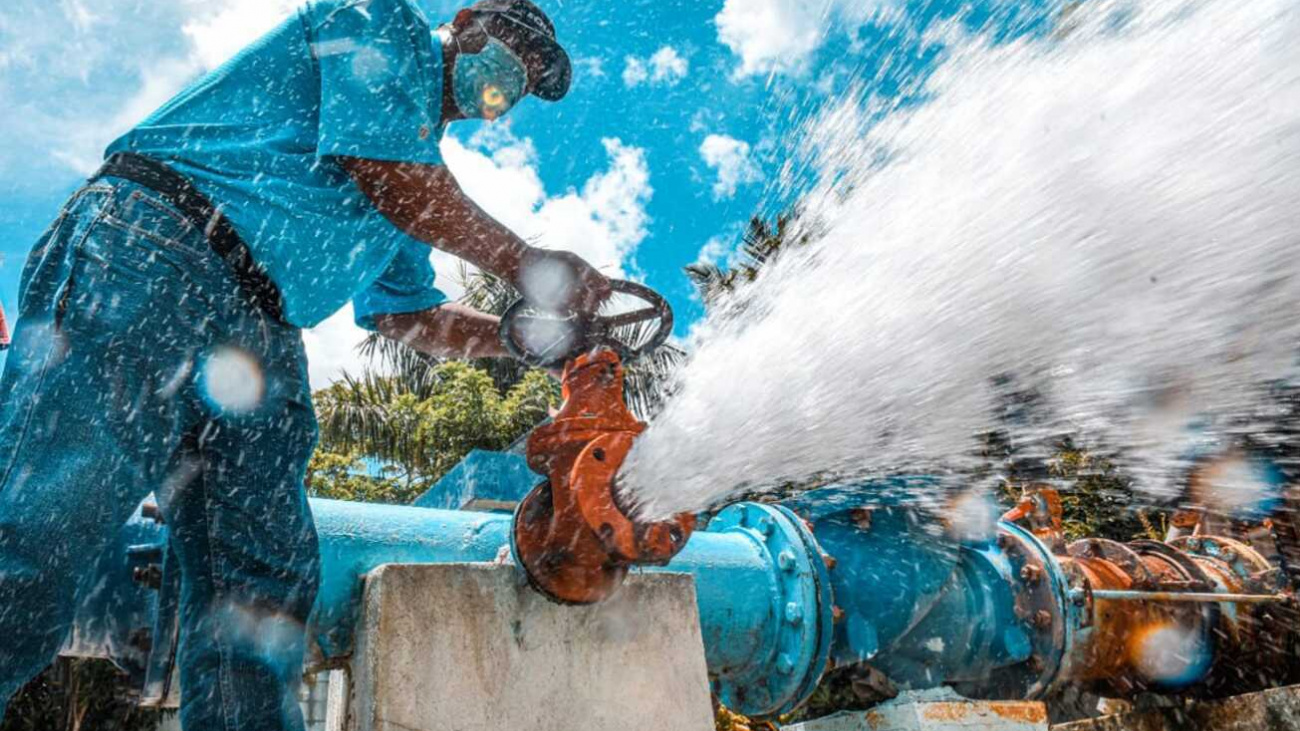
- 84.3% of Dominican households drink bottled water. This is the most striking figure in the report and the one that best illustrates the gap between the formal infrastructure, the water supply system, and the population's actual trust in it.
- Only 5.9% drink tap water inside their homes.
- 3.2% resort to the processed water truck, an informal market that circulates through urbanizations and neighborhoods selling drinking water to homes.
- 1.6% use the public key.
- 1.1% drink rainwater, concentrated in southern and southwestern provinces where the public network has less coverage.
- Drinking in public is prevalent in both urban (87%) and rural (77.1%) areas: in the countryside it competes with more precarious sources: springs, rivers or streams (2.5% rural vs. 0.04% urban), rain (3.6% vs. 0.2%) and public taps (3.5% vs. 0.9%).
What this says for the territory: the provinces most dependent on the truck are urban markets with an installed network, but without confidence in the quality of the supply.
The provinces with the greatest use of rainwater as a source of drinking water are, in many cases, also provinces with potential for tourism development , southwest, northwest, where water infrastructure is a bottleneck for the viability of any project.
Domestic water: where the network does reach
For washing, scrubbing and bathing, the picture changes.
- 62.7% of households use the water supply within the home.
- 10.7% have it in the yard.
- 5% access via public tap, another 5% via street pipe, and an additional 5% use a tubular well.
- The tanker truck serves 4.8%.
The difference between the 62.7% who use the aqueduct for domestic use and the 5.9% who use it for drinking is the clearest portrait of the structural distrust in the system: the water arrives, but not in conditions that the population considers safe for human consumption.
In urban areas, 69.8% of households have access to piped water within their homes for domestic use. In rural areas, that percentage drops to 44%, with wells accounting for 9.3%, a relevant figure for projects in peri-urban expansion areas where piped water has not yet arrived but residential demand has.
Sanitation: toilet predominates, latrine persists
- 87% of Dominican households have a toilet.
- 10.2% use a latrine.
- 2.8% do not have any type of health service.
Behind these averages, the urban-rural gap is pronounced. In urban areas, 93.5% have a toilet and only 1.4% lack sanitation services. In rural areas, toilet access drops to 70.2%, latrines rise to 23.4%, and 6.4% have no sanitation facilities at all.
Latrine data is important for the real estate because it defines the minimum standard of formal habitability in expanding areas. Municipalities and municipal districts with the highest prevalence of latrines are those most in need of investment in sanitation infrastructure before a formal housing project can be viable without the developer bearing the cost.
Sanitary connection: the domain of the septic tank
The type of sanitation connection reveals the second structural flaw in the report. Of the 3,623,971 households with some type of sanitation service, 68.6% connect to a septic tank. Only 25.2% connect to the public network or sewer system.
Public network/sewerage area Septic tank Natural drainage Other
National 25.2% 68.6% 4.1% 2.1%
Urban 32.1% 63.3% 3.4% 1.1%
Rural 5.9% 83.3% 6.1% 4.7%
In rural areas, 83 out of every 100 households with sanitation services discharge into septic tanks. Public sewage systems reach only 5.9%.
For the tourism and real estate development corridors , east coast, north coast, emerging southwest, this table is the map of the actual health infrastructure.
Where sewage systems do not exist, each project creates its own disposal system, and the sum of these individual systems, in areas of high density and shallow water table, is an environmental and legal risk equation that the sector has not yet finished calculating.
Garbage: dominant collection, burning in the countryside
Solid waste disposal completes the picture at the national level:
- 85.9% of households dispose of their garbage through municipal collection.
- 7% burns it.
- 2.4% of it ends up in a landfill.
- 1.4% hire private companies.
The urban-rural divide here is the most acute in the entire report. In urban areas, 92.4% have municipal waste collection. In rural areas, that percentage drops to 69.1%—and 21.4% burn their garbage. One in five rural households disposes of their solid waste by burning it.
National Method Urban Rural Households
Municipal collection 85.9% 92.4% 69.1% 3,203,296
Burn 7.0% 1.5% 21.4% 259,948
Landfill 2.4% 2.4% 2.5% 91,289
Private company 1.4% 1.2% 2.1% 53,313
River or stream 1.2% 1.2% 1.2% 44,351
For development projects in areas without established municipal waste collection, the cost of solid waste management is an underestimated variable. The report identifies which territories lack this service, and these are the same areas where the appeal of inexpensive land and natural landscapes attracts alternative tourism development.
Overview
Put together, the map drawn by Fascicle II of the ONE has a coherent internal logic: the same territories accumulate multiple deficits: the household that drinks rainwater also tends to have a latrine and burn its garbage.
A home that has its own water supply usually has a toilet connected to a septic tank and municipal collection, even if it continues to drink bottled water.
For the real estate sector, this coherence has a practical implication: the feasibility analysis of a project anywhere in the territory should incorporate these six variables as contextual conditions, not as optional amenities.
The market that buys in an area without sewage systems, without reliable garbage collection, and without direct drinking water is not just buying an asset: it is buying the cost of solving what public infrastructure fails to solve.
That cost exists. The 2022 census has just quantified its magnitude, province by province, municipality by municipality, down to the municipal district level. The data is there, waiting to be analyzed.
Source: Fascicle II. Water and sanitation in households in the Dominican Republic. X National Population and Housing Census 2022, ONE, May 2026.
Recommended readings: