Jardines del Sur enters the top 10 for the first time
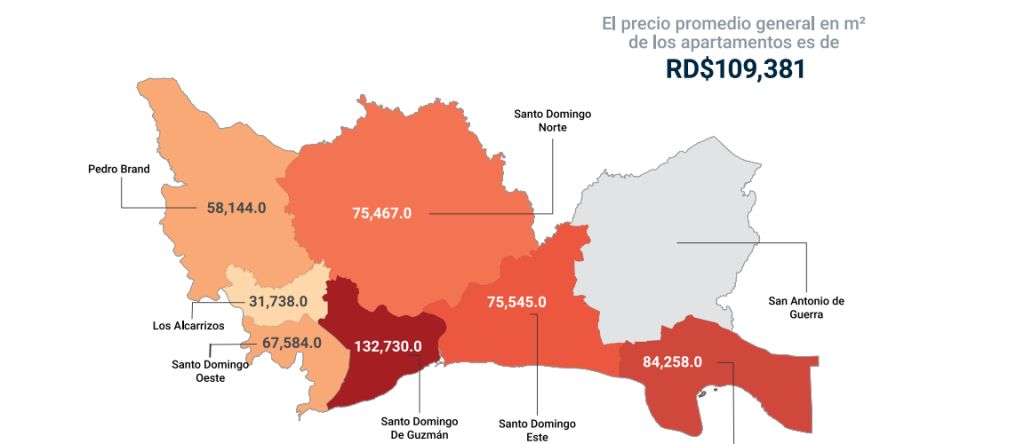
SANTO DOMINGO – The real estate market is segmented not only by price, but also by location. The Building Supply Registry (ROE 2025-2) allows for precise mapping of this segmentation by identifying the areas with the highest average price per square meter of apartments in the metropolitan region of the Dominican capital.
The ranking, which considers 20 sectors with five or more registered works, is headed by Piantini, with an average price of RD$172,377 per square meter, followed by La Julia, with RD$165,457 and Renacimiento, where you have to pay RD$162,539 for each square meter of house, consolidating a group of sectors that exceed RD$160,000 per m².
Within the same group are La Esperilla, where a square meter of housing costs RD$154,939, Ciudad Universitaria, where RD$149,762 is paid per square meter, Ensanche Naco, at RD$148,926 and Gascue where RD$145,139 is paid. All with values higher than RD$140,000 per square meter.
These seven sectors form the core of the highest value within the market, concentrating the highest prices in the formal supply of apartments.
This ranking only applies to apartment units, as ONE excluded the price of off-plan construction.
A second stop
Below that group and completing the ten sectors with the highest average price are Bella Vista, with a price of RD$133,825 per meter, Alma Rosa, where it costs RD$117,440 andJardines del Sur, where a meter costs RD$107,874.
Although they remain within the top ten, they show a significant difference compared to the highest levels of the ranking, marking a second tier within the same segment.
Chart 44 of the report also shows variations in the position of some sectors compared to the previous measurement.
Source: ONE
Piantini moves up one position and La Julia up two, while neighborhoods like La Esperilla, Ensanche Naco, and Gascue drop in the rankings. Others, like Bella Vista, appear as new entries in the upper tiers.
These movements reflect adjustments in the relative position of the sectors, rather than structural changes in the price level.
Concentration and hierarchy
The fact that the analysis is limited to sectors with five or more projects allows us to observe the behavior of the formal market, where the price per square meter is defined based on a base of projects under development.
Within this universe, the highest values are concentrated in a relatively small group of sectors, which demonstrates an unequal distribution of real estate value in the city.
Beyond price levels, the ranking shows a stable hierarchical structure, in which certain sectors consistently remain in the top positions.
This stability suggests that real estate value depends not only on cyclical factors, but also on structural conditions such as location, type of development, and the profile of the market to which the projects are directed.
A city segmented by location
Taken together, the ROE 2025-2 data show that the metropolitan region's real estate market is segmented not only by product type or income level, but also by a well-defined territorial hierarchy: a market where location not only influences price, but also defines position within a clear value scale.
More than a price list, the ranking functions as a map of urban value, in which each sector occupies a specific position within the market structure.
Top 10 sectors with the highest average price per m² (ROE 2025-2)
| Position | Sector | Average price (RD$/m²) |
| 1 | Piantini | 172,377 |
| 2 | Julia | 165,457 |
| 3 | Renaissance | 162,539 |
| 4 | The Little Pear | 154,939 |
| 5 | University City | 149,762 |
| 6 | Naco Extension | 148,926 |
| 7 | Gascue | 145,139 |
| 8 | Bella Vista | 133,825 |
| 9 | Alma Rosa | 117,440 |
| 10 | Southern Gardens | 107,874 |
Recommended readings: